Build the bridge
Separated volume, rate, mix, payroll and overhead effects by business unit, property and month.
Case study 01 · Performance diagnostics
How a revenue-to-EBITDA bridge and reporting reconciliation can separate genuine operating underperformance from mapping gaps—and focus leadership on the assets with the clearest recovery potential.
A multi-entity portfolio was reporting revenue growth but weakening EBITDA conversion. Executive reporting also contained gaps between operating-entity accounts and the consolidated performance pack.
Leadership could not distinguish operating underperformance from reporting omissions. Portfolio mix, cost pressure and incomplete mappings obscured where recovery action would have the highest value.
Separated volume, rate, mix, payroll and overhead effects by business unit, property and month.
Traced unmapped revenue, EBITDA and profit records from the general ledger into management-reporting lines.
Tested occupancy, ADR, RevPAR, property fees and project profitability to identify the assets driving the gap.
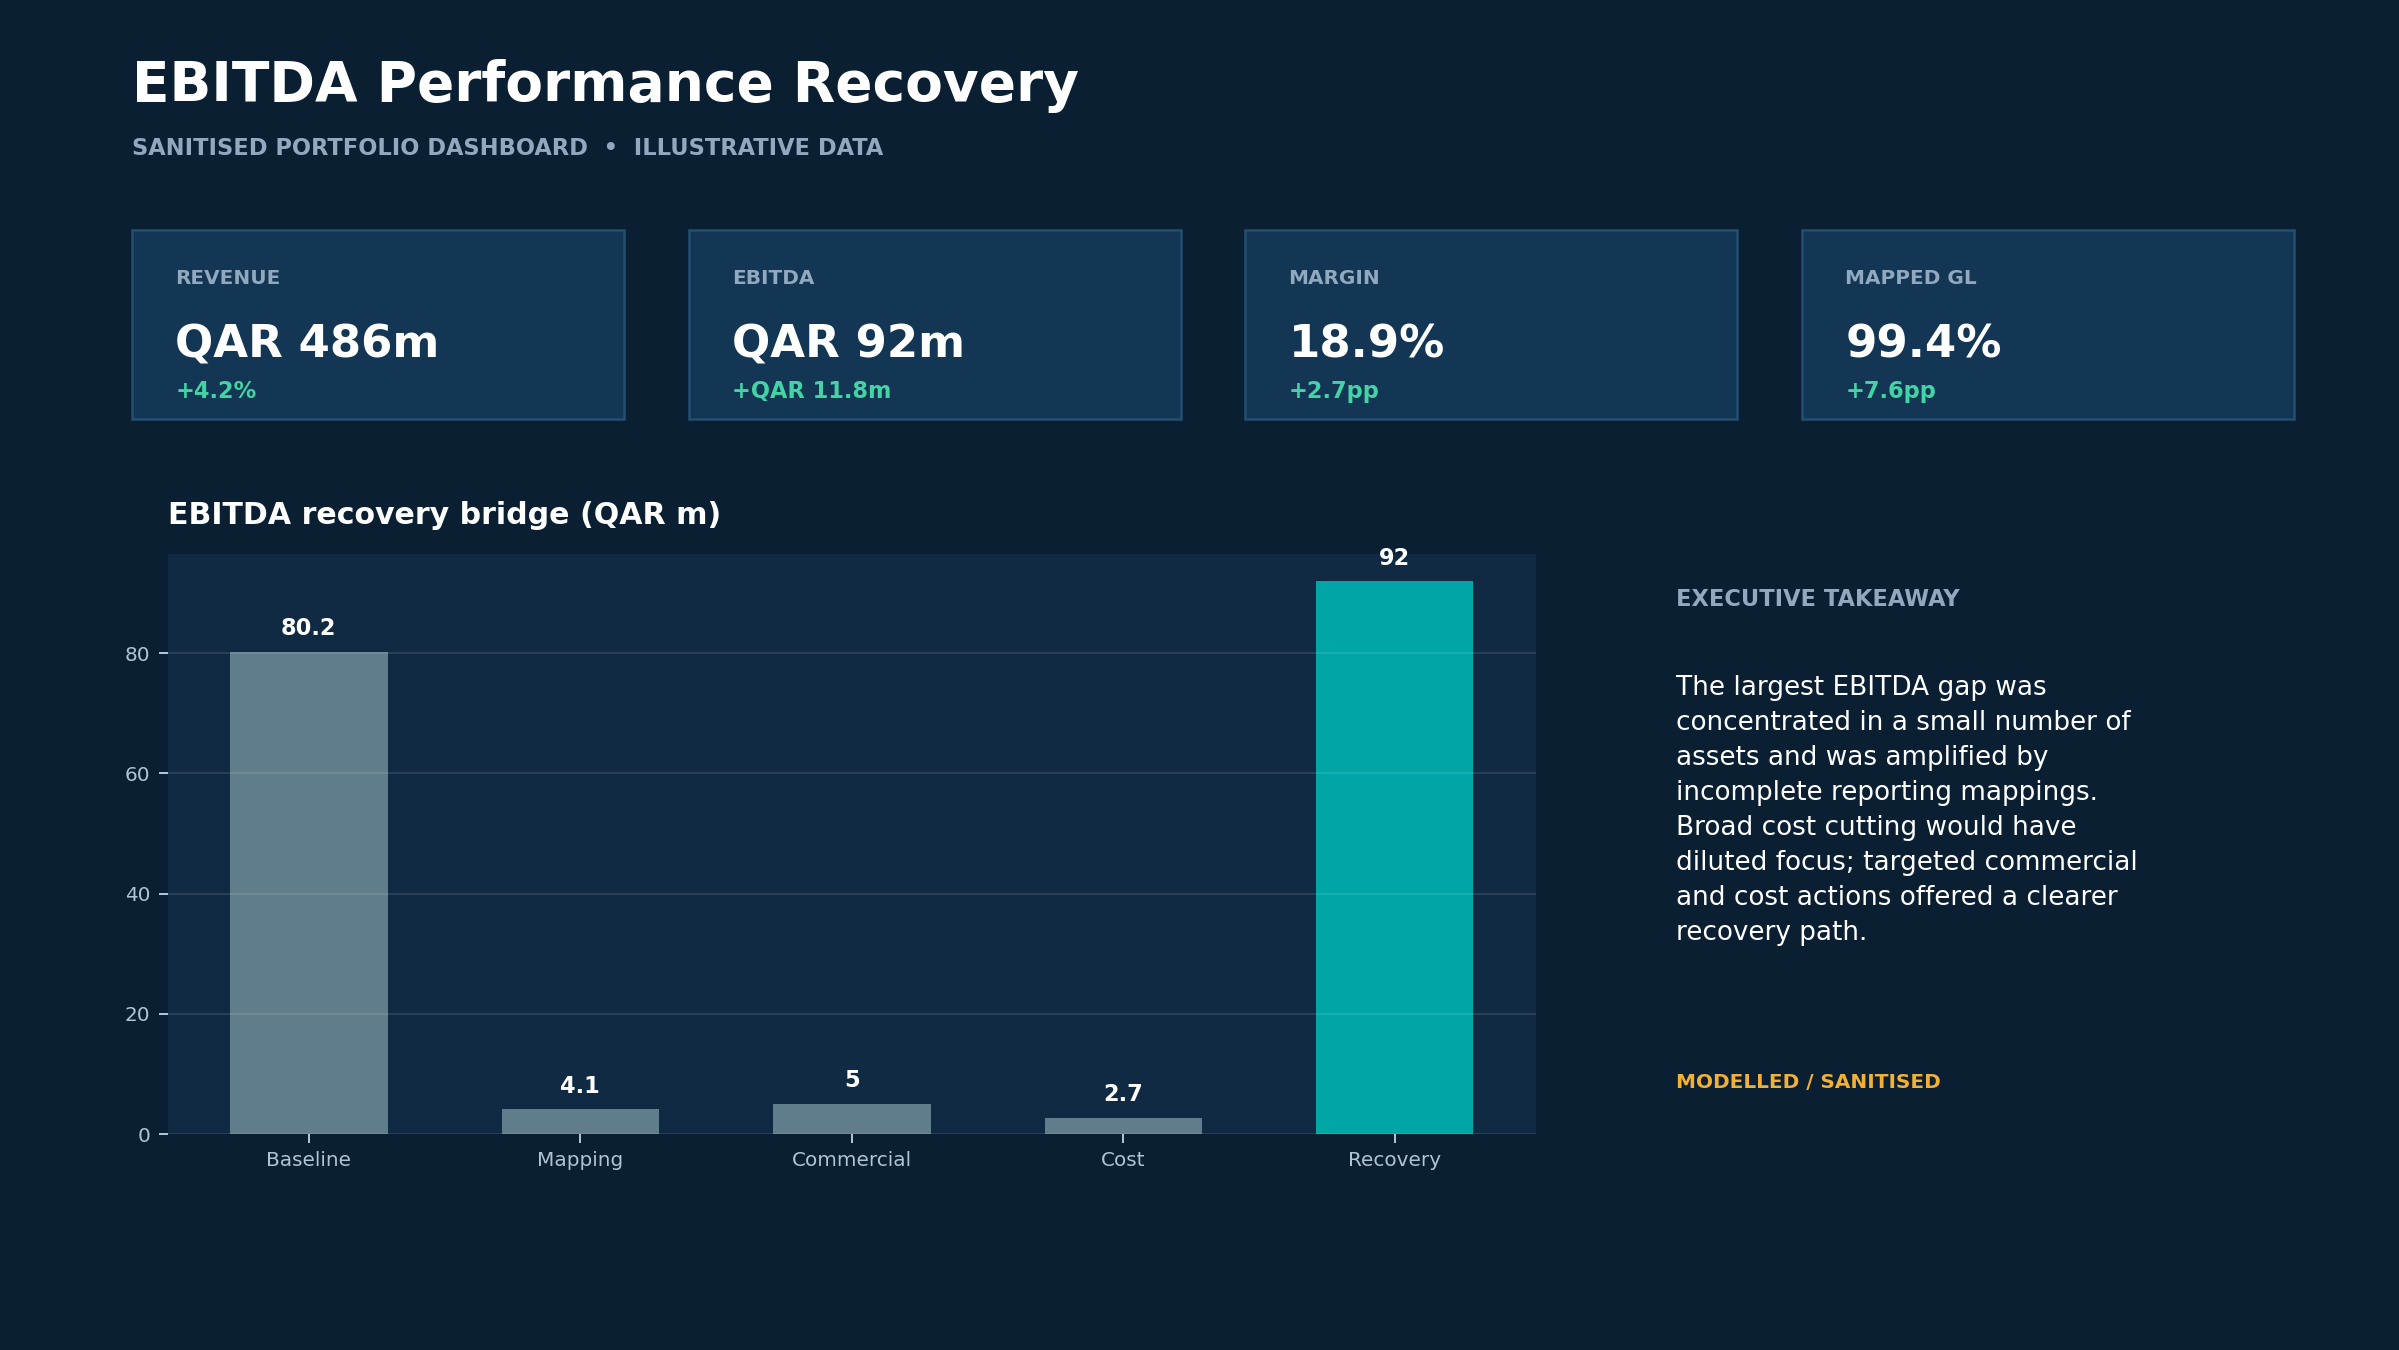
Illustrative dashboard using fictional names and modelled values.
The largest EBITDA gap was concentrated in a small number of assets and amplified by incomplete reporting mappings. Broad cost cutting would have diluted focus; targeted commercial and cost actions offered a clearer recovery path.
Correct the account-to-KPI mapping, introduce a monthly EBITDA bridge and assign 90-day recovery plans to the assets driving most of the variance—while protecting high-performing assets from blanket reductions.
QAR 11.8m annualised EBITDA improvement and a 2.7 percentage-point margin recovery, alongside stronger confidence in the executive performance pack.